
Let’s be honest: tracking social media likes won't get you a seat at the revenue table. For B2B SaaS marketers, the only true north star is the direct impact your campaigns have on the bottom line. It’s about moving beyond vanity metrics and focusing intently on what actually drives the business forward.
The goal here is to completely reframe your approach. Instead of just tracking activity—like clicks and impressions—you need to measure real, undeniable business results.
"Most marketing campaigns fail at the measurement stage, not the execution stage. Your creative might be brilliant, your targeting precise, and your timing perfect. Yet, you still can't prove it worked. The reason? You likely defined success after launching instead of before."
This is a fundamental shift that requires you to think like a CFO. Every campaign, every piece of content, and every dollar spent has to be justified by its contribution to real business objectives.
Tying Actions to Business Outcomes
Effective measurement starts long before you even launch a campaign. It begins with defining what "success" looks like in terms your executive team actually understands. Forget generic advice; your goals have to be super specific to your situation.
For instance, say your SaaS company is launching a new premium feature. The objective is crystal clear: drive upsells and increase Annual Recurring Revenue (ARR). In this case, success isn't measured by blog traffic. It’s measured by the number of existing customers who upgrade.
On the other hand, if you're a company breaking into a totally new industry vertical, your goal is different. You need to establish a beachhead and acquire your first 20 customers. Your primary metrics would revolve around new logo acquisition and Customer Acquisition Cost (CAC) within that specific segment.
This context-driven approach is what keeps your measurement framework relevant. It forces you to ask the hard questions upfront:
- What specific business outcome will this campaign actually influence?
- How are we going to directly measure that influence and tie it back to revenue?
- What’s the minimum return we need to justify this investment?
This kind of strategic alignment is non-negotiable in today's market. With digital advertising dominating marketing spend, the pressure for data-driven measurement has never been higher. In 2024, digital ads accounted for approximately 72.7% of worldwide ad expenditure, and the total market was valued at a massive $667 billion. You can't justify that kind of investment without rigorous performance tracking to maximize every dollar.
By connecting every marketing touchpoint to a tangible business result, you start telling a powerful story of value. This is where a well-defined plan, like the one we map out in our content marketing strategy framework, becomes absolutely essential. It’s what helps you translate actions into measurable success, and it’s the key to proving marketing is a growth engine, not just a cost center.
Choosing Metrics That Actually Matter for Your Funnel

In the world of B2B SaaS, where sales cycles can drag on for months, not all metrics are created equal. You have to move past the surface-level numbers and connect your KPIs to each specific stage of the buyer's journey.
It's a classic mistake: a metric that's perfect for top-of-funnel awareness is completely useless when a prospect is one step away from signing. Too many teams apply a one-size-fits-all measurement approach and wonder why their data doesn't tell a clear story.
The secret is picking metrics that act as signposts, confirming that a prospect is actually moving forward.
Gauging Awareness Beyond Impressions
At the top of the funnel (TOFU), the goal is simple: get on your ideal customer's radar and show them a solution to their problem exists. Impressions and reach are a start, but they don’t tell you if you’re attracting the right people.
To really know if you're building awareness, you need to hunt for signals of genuine interest.
- Branded Search Lift: Are more people Googling your brand name after your campaign goes live? Keep an eye on Google Search Console. A steady climb is a killer sign that your brand recall is growing.
- Direct Traffic Growth: An uptick in visitors typing your URL straight into their browser means your brand is becoming memorable.
- Share of Voice (SOV): How often is your brand mentioned online compared to your competitors? Tools like Brand24 or Mention can track this, showing your actual influence in the industry.
These metrics prove you're building mental real estate, not just racking up empty views.
Tracking Intent in the Consideration Stage
Once a prospect knows who you are, the middle of the funnel (MOFU) is all about nurturing their interest and proving your SaaS is the best choice. Here, engagement is everything. You're looking for actions that scream, "I'm seriously evaluating my options."
This is where smart digital advertising really shines. For instance, search ads can boost brand awareness by up to 80%, and a well-run Google Ads campaign can deliver an average ROI of 800%. According to Digital Silk, these channels turn interest into measurable results.
For this stage, you should be laser-focused on:
- Demo Request Conversion Rate: The percentage of visitors who sign up for a demo. This is one of the hottest buying signals in B2B SaaS, period.
- Content Engagement Score: Go deeper than just downloads. Track how people interact with your best assets. Did they watch 75% of the webinar? Did they stick around on the pricing page right after reading a case study?
- High-Value Page Visits: Monitor visits to pages that signal serious intent, like your pricing, integrations, or competitor comparison pages.
A prospect who downloads three case studies and then checks out your pricing is infinitely more valuable than someone who just grabs a TOFU checklist. If you really want to nail this, dive into the specific content marketing metrics that reveal true engagement.
Mastering the Bottom-Funnel Financial Metrics
When a prospect hits the decision stage (BOFU), your metrics need to pivot hard to business outcomes and financial efficiency. This is where you prove marketing's direct contribution to revenue. Your CEO doesn't care about click-through rates; they care about growth and profitability.
At this stage, you must master the essential trio of financial KPIs. These are the numbers that directly connect your marketing spend to the health of the business and justify future investment.
Here’s what you need to have on lock:
- Customer Acquisition Cost (CAC): The total sales and marketing cost to acquire one new customer. A low, stable CAC shows your marketing is efficient.
- Customer Lifetime Value (LTV): The total revenue you expect from a single customer over their entire relationship with you. A high LTV means you’re landing valuable, sticky customers.
- The LTV:CAC Ratio: This is the ultimate health check. A solid SaaS business typically aims for an LTV:CAC ratio of 3:1 or higher. It means the value of a customer is at least three times what you spent to get them.
To tie it all together, here’s a quick breakdown of which metrics to focus on at each stage of the funnel. Think of this as your cheat sheet for connecting marketing activities directly to business goals.
Key B2B SaaS Metrics by Funnel Stage
Using this framework ensures you're not just busy, you're effective. You're tracking what matters, proving your impact, and making smarter decisions that actually grow the business.
Building Your Measurement and Tracking Tech Stack

Accurate measurement is impossible without the right tools working together. I've seen it time and again: a siloed tech stack, with data trapped in different platforms, is the number one reason marketers can't prove ROI. You need a setup that gives you a clear line of sight across the entire customer journey, from the very first ad click to the final closed deal.
This isn't about buying the most expensive software on the market. It’s about creating a seamless flow of data between a few core platforms. The goal is to build a single source of truth that connects every marketing touchpoint to a real person and, ultimately, to revenue.
For most B2B SaaS companies, this comes down to three key pillars that absolutely have to communicate with each other.
The Essential Trio: CRM, Marketing Automation, and Analytics
Your entire measurement foundation rests on how well these three systems talk to each other. Get the integration right, and you’ll have a complete, end-to-end view of every campaign you run.
- Customer Relationship Management (CRM): This is your system of record for all things sales. Think platforms like Salesforce or HubSpot CRM. It’s where lead status, pipeline value, and closed-won deals live, making it the final word on revenue.
- Marketing Automation Platform (MAP): Tools like HubSpot, Marketo, or Pardot are the engines of your campaigns. They handle email nurturing, landing pages, and lead scoring. Your MAP is what captures that initial lead info before passing the good ones over to the CRM.
- Web Analytics: This is where you see what people are actually doing on your site. Google Analytics 4 (GA4) is the standard, giving you the lowdown on traffic sources, user behavior, and on-site conversions.
The real magic happens when these three are tightly connected. A click from a LinkedIn ad tracked in GA4 needs to create a lead in your MAP. When that lead is qualified, it should automatically become a contact in your CRM with all its original source data perfectly intact.
Without that connection, you're just flying blind.
The most sophisticated marketing analysis is useless if it’s based on dirty data. Your measurement is only as reliable as the weakest link in your tech stack. Prioritize clean data integration above all else.
This integration isn’t just a nice-to-have; it's completely non-negotiable for proving your marketing works.
The Unsung Hero of Tracking: UTM Parameters
UTM parameters are the glue that holds all your tracking together. They’re just simple tags you add to the end of your URLs, but they tell your analytics tools exactly where each visitor came from.
Honestly, neglecting them is like trying to solve a puzzle with half the pieces missing. Disciplined UTM usage is a non-negotiable habit for any serious marketing team. It’s how you attribute every lead and every dollar of pipeline back to a specific source.
To keep things from getting messy, you need a standardized framework. Don't let team members create UTMs on the fly—it’s a recipe for chaos. Use a shared spreadsheet or a dedicated tool to enforce consistency.
Your framework should clearly define the values for each parameter.
Tracking a Lead From Click to Close
Let's walk through a real-world example. Imagine you're running a LinkedIn ad campaign for a new ebook. Here’s how your tech stack and UTMs work together to follow a lead all the way through the funnel.
- The Click: A prospect sees your video ad on LinkedIn and clicks the link. The URL is tagged with
utm_source=linkedin,utm_medium=cpc, andutm_campaign=ebook-promo-q3. - The Conversion: They hit your ebook landing page. GA4 instantly records the visit and its source. The prospect fills out the form and downloads the guide.
- The Handoff: That form submission creates a new lead in HubSpot (your MAP). Thanks to the UTMs, the lead's "Original Source" property is automatically set to "Paid Social - LinkedIn." No manual entry needed.
- The Nurture: Over the next few weeks, the lead gets a nurture sequence and eventually requests a demo. Their lead score in HubSpot goes up, triggering a sync to Salesforce (your CRM) as a new Marketing Qualified Lead (MQL).
- The Deal: A sales rep takes over, creates an opportunity in Salesforce, and eventually closes the deal.
Because that original source data was passed cleanly from the ad click all the way to the CRM, you can now definitively say that new revenue came from your ebook-promo-q3 LinkedIn campaign.
This is how you stop guessing and start knowing what actually works.
Mastering Attribution Models and Data Analysis
Once your data is flowing cleanly, the next big challenge is making sense of it all. This is where attribution comes in—the art and science of assigning credit to the marketing touchpoints that actually led to a conversion. For B2B SaaS, with its notoriously long and complex customer journeys, getting this right is everything.
Attribution can feel like a black box, but it’s really about choosing a model that mirrors how your customers actually buy. A single-touch model, for instance, gives all the credit to one interaction. That’s just too simple for a considered purchase that might take months.
Choosing the Right Attribution Model
Simple models like First-Touch (crediting the first interaction) and Last-Touch (crediting the final one) are easy to set up but often paint a misleading picture. First-touch tends to overvalue top-of-funnel content, while last-touch gives all the glory to a demo request page, completely ignoring the months of nurturing that got the prospect there.
To see what's really happening, B2B SaaS marketers need to embrace multi-touch attribution. These models distribute credit across multiple touchpoints, acknowledging that no single blog post or ad closes the deal alone.
Here are a few common models:
- Linear: This model is the diplomat, giving equal credit to every single touchpoint. It's fair, but it doesn't distinguish between a minor blog view and a major webinar attendance.
- U-Shaped: A smart step up. Here, 40% of the credit goes to the first touch, 40% to the lead conversion touch, and the remaining 20% is spread across the interactions in between. This is great for highlighting what starts the journey and what creates the lead.
- W-Shaped: This model gets even more granular by assigning credit to three key milestones: the first touch, the lead conversion, and the opportunity creation. It gives you a much fuller view of that crucial marketing-to-sales handoff.
For B2B SaaS, the goal isn't just to find a model, but to find the one that best tells the story of your unique customer journey. Start with a U-Shaped or W-Shaped model. They strike a great balance between simplicity and a more nuanced view of the funnel.
Attribution is all about context. The right model for a freemium PLG product won't be the same as for a six-figure enterprise deal. To help you navigate this, here's a quick breakdown of the most common models.
Comparing Marketing Attribution Models
Choosing a model isn't a one-time decision. As your marketing evolves, you may find that a different model tells a more accurate story. The key is to start somewhere, test, and refine.
Analyzing and Segmenting Your Campaign Data
Collecting data is only half the battle. The real magic happens when you slice and dice it. Instead of staring at one monolithic number for "campaign performance," you need to break it down to uncover the hidden patterns. This is what separates marketers who report on data from those who use it to make winning decisions.
Start by segmenting your results by these key dimensions:
- By Channel: Compare the performance of your LinkedIn ads versus your Google Ads. Don't just look at lead volume; which channel produces leads with the highest conversion rate to MQL or Opportunity?
- By Persona: Are your campaigns hitting home with VPs of Engineering or with CFOs? Segmenting by persona or job title tells you if your messaging is landing, allowing you to tailor future content more effectively.
- By Offer: Did your "Ultimate Guide to X" ebook generate more qualified leads than your "ROI Calculator" tool? Analyzing performance by the content offer itself helps you understand what your audience truly values.
This infographic shows a perfect example of why this matters.
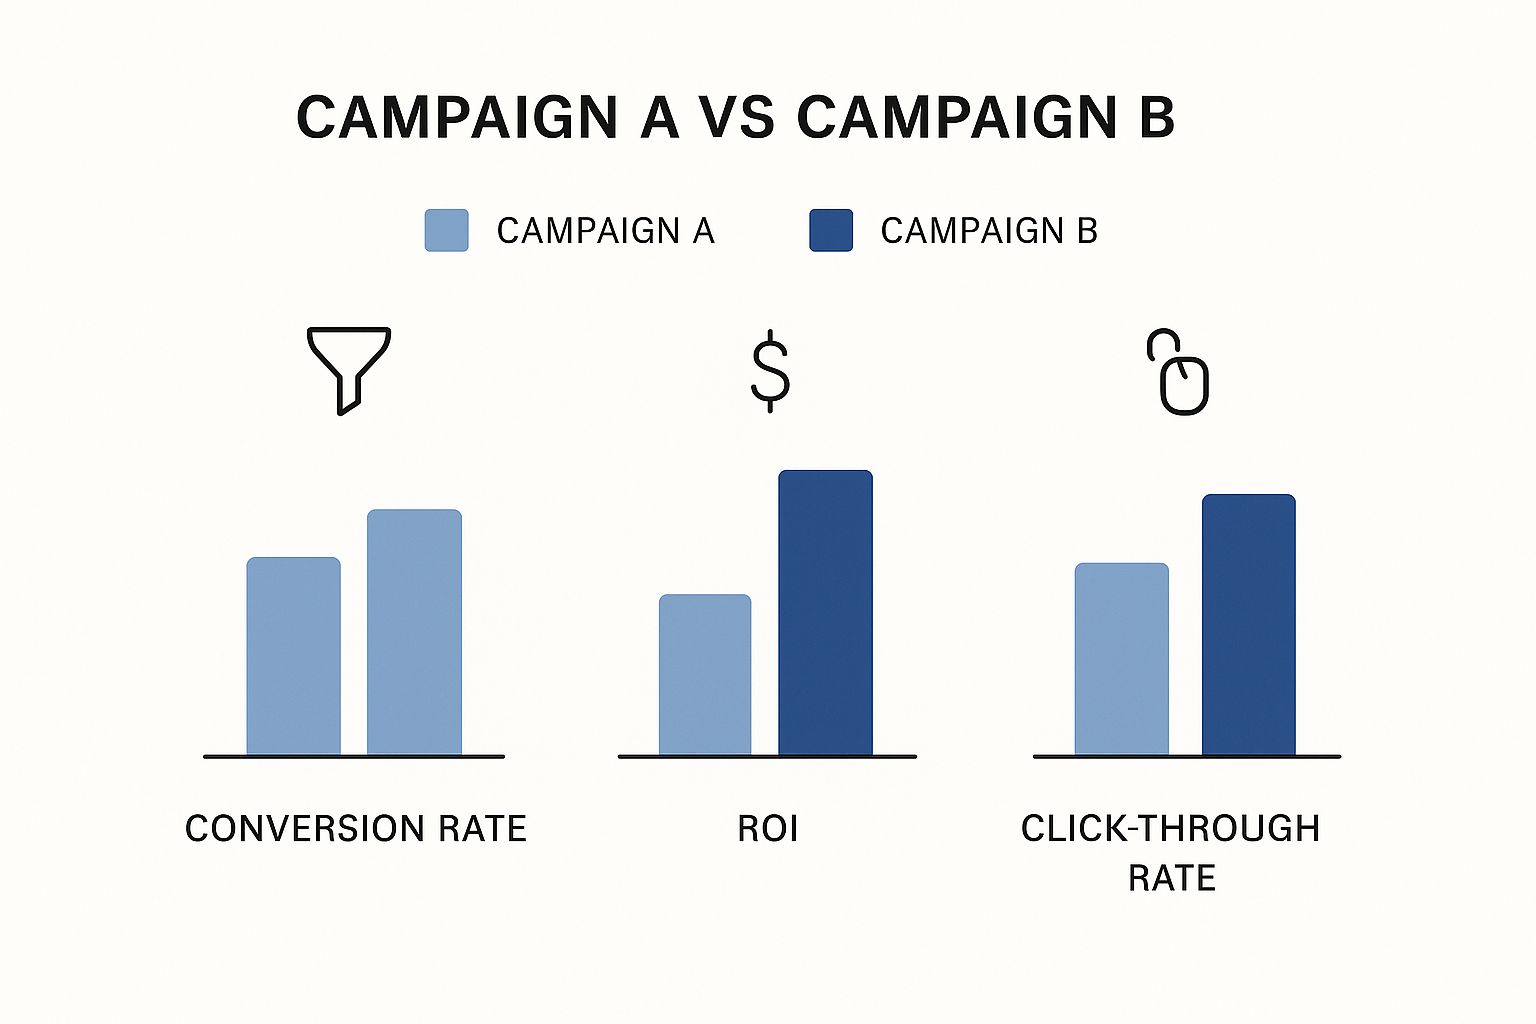
At first glance, Campaign A’s higher click-through rate might look like a win. But when you look closer, Campaign B delivered a far better conversion rate and ROI, making it the clear winner.
Dissecting a Sample Report
Let's imagine you're looking at a report for a recent webinar. The top-line number shows 200 new leads. Not bad.
But when you segment the data, the real story emerges.
An email blast drove the most sign-ups (120 leads), but the 50 leads from a targeted LinkedIn campaign converted to sales opportunities at a 3x higher rate. The final 30 leads came from organic social, but none of them converted. The insight is crystal clear: while email is great for volume, the paid LinkedIn campaign delivered far more actual business value.
This is why segmentation is a marketer's superpower. It helps you move beyond vanity metrics and make confident, data-backed decisions about where to put your next dollar. It also reminds us of the power of reliable channels. Email marketing, for instance, remains a beast, with some 2025 reports showing an average return of $42 for every $1 spent. You can find more on email marketing benchmarks at landingi.com.
This combination of broad channel analysis and deep segmentation is how you truly understand campaign impact.
Turning Insights Into Action and Reporting on Performance

Data is just noise until you use it to make a change. The final, and arguably most important, step in this whole process is turning your analysis into tangible improvements and then communicating those wins.
This is where you close the loop—transforming insights into optimizations that actually boost future performance.
Siloed software is often the culprit when metrics that prove ROI are hard to find. But by focusing on the right numbers and using them to guide your next move, you can turn your marketing department into a proven revenue engine. This isn't just about reporting on what happened; it's about actively shaping what happens next.
Driving Improvements with Iterative Testing
The most successful marketing teams don't rely on guesswork. They build a culture of continuous, iterative testing where small, data-guided changes lead to massive impact over time.
Instead of launching massive, high-risk overhauls, focus on a structured A/B testing program. The key is to target one variable at a time so you can get clean, actionable results.
Here are a few high-impact areas to start testing right away:
- Landing Page Headlines: Test a benefit-driven headline ("Cut Reporting Time by 50%") against a feature-focused one ("Our New Automated Reporting Feature").
- Ad Copy: Experiment with different emotional hooks. Does an ad highlighting a customer's pain point outperform one focused on a positive outcome?
- Email CTAs: Test your button text. Does "Request a Demo" convert better than "See a Live Walkthrough"? The wording can make a surprising difference.
Each test gives you a clear winner and a valuable lesson, allowing you to systematically optimize your conversion paths. This is a core practice for teams looking to master digital marketing for SaaS companies who know that marginal gains add up to significant growth.
Crafting a Performance Report That Resonates
Let's be blunt: CEOs don’t care about your click-through rates. When you're reporting to the C-suite, your job is to translate marketing metrics into the language of business outcomes. Your report needs to tell a compelling story about how marketing is driving revenue.
The best performance reports connect marketing efforts directly to the bottom line. They build a clear narrative, showing how a specific campaign influenced pipeline, shortened the sales cycle, or lowered customer acquisition costs.
To build a report that gets noticed, structure it around the metrics leadership actually values. Don't just hand over a spreadsheet—visualize the data and provide concise analysis that explains the why behind the results.
A Practical Template for C-Suite Reporting
Your report should be clear, concise, and focused on business impact. Ditch the marketing jargon and get straight to the point.
Here’s a simple structure that just works.
- The Executive Summary: Start with the main takeaway. Lead with the most important result, like "Q3 campaigns influenced $350k in new pipeline, a 15% increase over Q2." This immediately frames the conversation around revenue.
- Customer Acquisition Cost (CAC): We drove this down from $5,200 to $4,800.
- Lead-to-Opportunity Conversion Rate: Improved from 8% to 11%.
- Top Performing Channel: LinkedIn ads generated 40% of all MQLs this quarter.
- Campaign Breakdown and Key Insights: Briefly explain what worked and why. For instance, "The webinar campaign targeting CFOs had a 3x higher conversion rate than our general audience campaigns, proving a strong product-market fit with this persona."
- Next Steps and Recommendations: This is crucial. Show you're thinking ahead. Conclude with actionable recommendations: "Based on these results, we recommend reallocating 20% of the Q4 budget from paid search to LinkedIn to scale our success with the CFO persona."
- Weekly Checks (Leading Indicators): In the first few days and weeks, keep an eye on top-of-funnel engagement. Are people clicking your ads? Are they visiting the landing page? This tells you if the initial message is resonating.
- Monthly Reviews (Mid-Funnel Progress): After a few weeks, you should start seeing signs of deeper intent. Look for demo requests, trial sign-ups, and MQL-to-SQL conversions. These metrics show you're not just getting clicks, but attracting qualified leads.
- Quarterly Analysis (Bottom-Funnel Impact): This is where you finally get to tie your work to revenue. Assess the pipeline generated and closed-won deals. This timeframe should roughly line up with your average sales cycle, which for many is 30 to 90 days or even longer.
- Google Analytics 4 (GA4): This is non-negotiable. Use it to track your website traffic, user behavior, and on-site conversions.
- Native Ad Platform Analytics: Tools like LinkedIn Campaign Manager and Google Ads give you a ton of performance data right out of the box.
- An Airtight UTM Policy: This costs zero dollars but is probably your most valuable asset. Create a simple spreadsheet to standardize your UTMs and make sure everyone on the team sticks to it.
This approach doesn't just prove your team's value; it justifies your budget and secures investment for future campaigns by demonstrating a clear, undeniable return. It turns what could be a backward-looking exercise into a forward-looking strategic tool.
Common Questions About Measuring Campaign Effectiveness
Even with a perfect framework on paper, the real world of B2B SaaS marketing always throws curveballs. The long sales cycles and layers of decision-makers can make even simple metrics feel tangled and confusing.
Let's dig into the questions that actually come up in team meetings and budget reviews—the stuff that happens when you move from theory to practice.
How Long Should a Campaign Run Before Measuring It?
This is the classic B2B dilemma. For SaaS, you can’t just look at revenue after week one and call it a day. The journey from a first click to a closed deal can take months, so you have to measure it in phases.
Here’s a more realistic timeline for tracking your metrics:
The key is to avoid making huge budget decisions based on short-term revenue data. Use those early indicators to make small, smart adjustments, not to panic and pull the plug.
The biggest mistake is applying a B2C measurement timeline to a B2B sales cycle. Patience isn't just a virtue; it's a strategic necessity. Use early metrics to optimize, not to panic.
This phased approach lets you react quickly to tactical issues (like a bad ad or broken landing page) while giving your overall strategy the time it needs to actually work.
What Is the Biggest Mistake Marketers Make?
Hands down, the most common pitfall is getting obsessed with vanity metrics. It’s easy to get excited about a spike in impressions or social media likes, but those numbers are meaningless if you can't connect them to revenue.
But a close second—and arguably more damaging—is sloppy or nonexistent UTM tracking. Without clean, standardized data on where your traffic is coming from, accurate attribution is completely impossible.
Think of it like this: launching a campaign without proper UTMs is like throwing a massive party but forgetting to ask anyone for their name at the door. You know people showed up, but you have no clue who they are or how they heard about you. This one foundational mistake poisons all your other measurement efforts.
How Can Small Teams Measure Campaigns on a Tight Budget?
You absolutely do not need an enterprise-level martech stack to measure your campaigns effectively. For small teams, the name of the game is ruthless focus and discipline.
Start by mastering the free tools at your disposal:
Instead of trying to track dozens of metrics, pick one or two that are closest to generating revenue. For most SaaS companies, this means focusing squarely on Free Trial Sign-ups or Demo Requests. Orient every campaign and report around moving those specific numbers. When resources are limited, simplicity is your best friend.
At PimpMySaaS, we help B2B SaaS companies cut through the noise by building a powerful brand presence where your customers are already looking for solutions. We get your brand cited in LLM responses and drive conversations that translate directly into high-intent leads. Ready to see how we connect visibility to revenue? Visit us at https://www.pimpmysaas.com.