
So, what are content marketing metrics, really?
Think of them as data points that tell you whether your content is actually working. They're the signals that let you know if your articles, videos, and social posts are hitting their mark—whether that's reaching the right people, pulling in leads, or driving sales.
Why Content Marketing Metrics Are Your Growth Compass
Creating content without measuring it is like trying to navigate a ship without a compass. Sure, you're moving, but you have no clue if you're headed for your destination or sailing straight into a storm. Content marketing metrics are that compass. They give you clear direction and help you make smart decisions instead of just guessing what your audience wants.
Every blog post, video, or social update you publish is an investment of your time and money. Without metrics, it's a gamble. With them, it becomes a calculated strategy. These data points turn fuzzy goals like "brand awareness" into real numbers you can track, analyze, and actually improve.
Moving Beyond Guesswork to Growth
Metrics strip the subjectivity out of your strategy. Instead of wondering if people liked your latest article, you can look at the average time on page to see how long they actually spent reading it. Instead of hoping a new e-book is valuable, you can track its conversion rate to see how many people bothered to download it.
This data-driven approach means you can double down on what truly resonates with your audience.
The whole point of tracking content marketing metrics is to replace assumptions with certainty. It’s how you figure out what your audience values, which channels are worth your time, and how your content is making a real impact on the business.
And let's be honest, the content marketing world is exploding. The global market hit $413.2 billion in 2022 and is on track to smash $2 trillion by 2032. That's a massive opportunity, but it also means the competition is fierce. Only the most effective, data-backed strategies are going to win. You can read more about these content marketing statistics and trends to see just how fast things are changing.
The Four Pillars of Content Measurement
To get the full picture, we’re going to break our metrics down into four key categories throughout this guide. Each one answers a different, crucial question about your content's performance:
- Consumption Metrics: Is anyone even seeing our content? These metrics cover your reach and basic viewership.
- Engagement Metrics: Are people actually interacting with our content? This tells you if your audience is interested and connecting with your message.
- Conversion Metrics: Is our content driving action? This is where we tie content directly to business goals like sign-ups or sales.
- Retention Metrics: Are people coming back for more? This measures long-term loyalty and the lifetime value of your audience.
By understanding how these four pillars work together, you can turn your content from a creative expense into a predictable engine for growth.
Decoding What Your Audience Actually Reads
Before you can even think about conversions or customer loyalty, you have to answer a much more fundamental question: is anyone even reading this stuff? That’s where consumption metrics come in. They’re the ground floor of your entire measurement strategy, telling you if your content is reaching people and what they do when they get there.
Think of these metrics as the first handshake. They don't tell you if you've closed a deal, but they do tell you if someone was willing to shake your hand in the first place. Without solid consumption numbers, trying to track higher-level goals like leads or sales is a complete waste of time.
Page Views And Unique Visitors
The most basic consumption metrics are Page Views and Unique Visitors. People often lump them together, but they tell two different stories about how big and active your audience really is.
- Page Views: This is simple. It's the total number of times a page on your website was loaded. If one person reads your article three times, that’s three page views. It’s a raw count of your content's popularity.
- Unique Visitors: This tracks the actual number of individual people who visited your site over a set period. That same person visiting three times? They only count as one unique visitor. This gives you a much better sense of your true audience reach.
So what's the story they tell together? A high number of page views but a much lower number of unique visitors usually means you have a small, loyal audience coming back again and again. On the other hand, if those two numbers are pretty close, it suggests you're great at attracting new people, but maybe not so great at getting them to return.
The True Meaning Of Time On Page
While views tell you if people showed up, Average Time on Page tells you if they decided to stick around. Honestly, this is one of the most direct pieces of feedback you can get. A visitor can accidentally click a link, but they can't accidentally spend three minutes reading your article.
A longer average time on page is a huge signal that your content is hitting the mark—it's valuable, engaging, and matches what the visitor was looking for. It means your writing is actually holding their attention. If you see a blog post with tons of traffic but an average time on page of only 15 seconds, you've got a problem. Your headline might be amazing, but the content itself isn't delivering.
Demystifying The Bounce Rate
Bounce Rate is the percentage of visitors who land on a page and leave without doing anything else—no clicks, no navigating to another page. Nothing. A lot of marketers treat a high bounce rate like a scarlet letter for bad content, but it's not that simple.
A high bounce rate isn't always a sign of failure. If your content perfectly answers a user's question on a single page, they might leave satisfied without needing to click further. Context is everything when interpreting your bounce rate.
For example, someone might Google "what is a content marketing metric," land on your blog, find the answer in the first paragraph, and leave. Mission accomplished, right? They got what they needed. In that case, the bounce isn't a bad thing. But a high bounce rate on a landing page designed to get sign-ups? That’s a massive red flag. Understanding the nuance here is a core part of implementing effective content marketing best practices.
The screenshot below from a Google Analytics dashboard shows how these behavioral metrics are usually laid out.

This kind of visual summary lets you quickly spot patterns, like whether a recent spike in users also led to a change in engagement time. It’s all about connecting the dots between your content's performance and how your audience behaves.
Gauging Audience Interaction and Brand Health

Knowing people read your content is a good start, but it's only half the story. The real magic happens when they decide to do something about it. Engagement metrics are what turn your content from a monologue into a conversation, signaling that your audience isn't just passively consuming—they’re actively participating.
Think of these content marketing metrics as the digital equivalent of a nod, a question, or applause from a live audience. They show that your message is hitting home on a deeper level, building the foundation for a real community and long-term brand loyalty.
The Voice of Your Audience
Simple social media metrics like Likes, Comments, and Shares are sometimes written off as "vanity metrics," but that’s a mistake. When you look at them as real-time feedback, they provide powerful clues about how your audience feels.
Each one tells a slightly different story:
- Likes: A Like is a quick thumbs-up. It's the lowest-effort engagement, but it’s an instant confirmation that your content caught someone's eye and they found it interesting or agreeable.
- Comments: A comment is a direct line into your audience's head. It shows someone was invested enough to stop, think, and share their perspective. The sentiment in your comments section can be a goldmine for your next big content idea.
- Shares: A share is the ultimate social endorsement. When someone shares your content, they’re vouching for it. They're putting their own reputation on the line by recommending it to their personal network.
Tracking these interactions helps you figure out what kind of content doesn't just attract eyeballs but actually inspires people to act. A post with fewer views but a ton of shares might be far more valuable than one that gets thousands of views and zero interaction.
The Power of Third-Party Endorsements
Beyond social media likes and shares, one of the most powerful engagement metrics you can track is Backlinks. A backlink is simply a link from another website to your content. In the worlds of SEO and content marketing, this is a massive vote of confidence.
It means another creator, blogger, or publication found your content so useful that they were willing to send their own audience over to you. Earning high-quality backlinks not only drives valuable referral traffic but also massively boosts your site’s credibility in the eyes of search engines like Google.
A backlink isn't just a link; it's a testament to your content's authority. Each one signals to search engines that your material is a trusted resource, which is a critical factor for improving your organic rankings over time.
This is exactly why backlink acquisition is a core goal for any serious content strategy.
Measuring Your Brand’s Presence
To get a bigger-picture view of your content's impact, you need to look at your Share of Voice (SOV). This metric tells you how visible your brand is in the market compared to your competitors. It answers one key question: "Of all the conversations happening in our industry online, what percentage are about us?"
You can track SOV by monitoring brand mentions, important keywords, and relevant hashtags across social media, blogs, and forums. A rising Share of Voice is a clear sign your content marketing is working—you’re successfully capturing more attention and positioning your brand as a leader in your field. It takes you beyond individual post performance to measure your overall influence.
Connecting Content Directly to Business Results
Engagement metrics are a great starting point—they tell you people are paying attention. But conversion metrics? That's how you prove content’s value in the one language every C-suite executive speaks: revenue.
This is where your content marketing stops being a creative expense and starts becoming a measurable revenue driver. Without tracking conversions, you’re just making noise. With them, you can draw a straight line from your blog posts, white papers, and webinars directly to a growing sales pipeline.
From Clicks to Customers
The goal here is simple: measure how well your content convinces a visitor to take a valuable action. We're moving beyond views and likes to focus on the outcomes that actually grow the business.
This means zeroing in on a few critical content marketing metrics:
- Lead Generation: How many new leads did your content bring in? This could be anything from a newsletter signup to a demo request or a "contact us" form submission. It’s the first handshake.
- Conversion Rate: This is the percentage of people who take that desired action. If 100 people read a blog post and 5 download the e-book you offered, your conversion rate is a clean 5%.
- Cost Per Acquisition (CPA): How much did it cost, in total, to win a single paying customer through your content? A low CPA means your strategy is efficient and profitable.
These numbers give you the hard data to justify your budget and prove the financial impact of your work. They show you’re not just attracting an audience; you’re attracting the right audience and guiding them toward a purchase.
Setting Up Goals to Measure Success
You can't track what you don't define. To measure conversions accurately, you first need to decide what a "conversion" actually means for your business. Is it a form submission? An event registration? A free trial signup?
Once you know, you can set up goals in tools like Google Analytics. This allows the platform to attribute those actions back to the specific content that got the user to act. It’s how you can confidently report, "Our new case study generated 15 qualified leads this month."
For a deeper dive into aligning these metrics with your overall strategy, our complete content marketing strategy framework breaks it all down.
The right setup lets you visualize everything—from conversion performance to traffic sources—in one place.
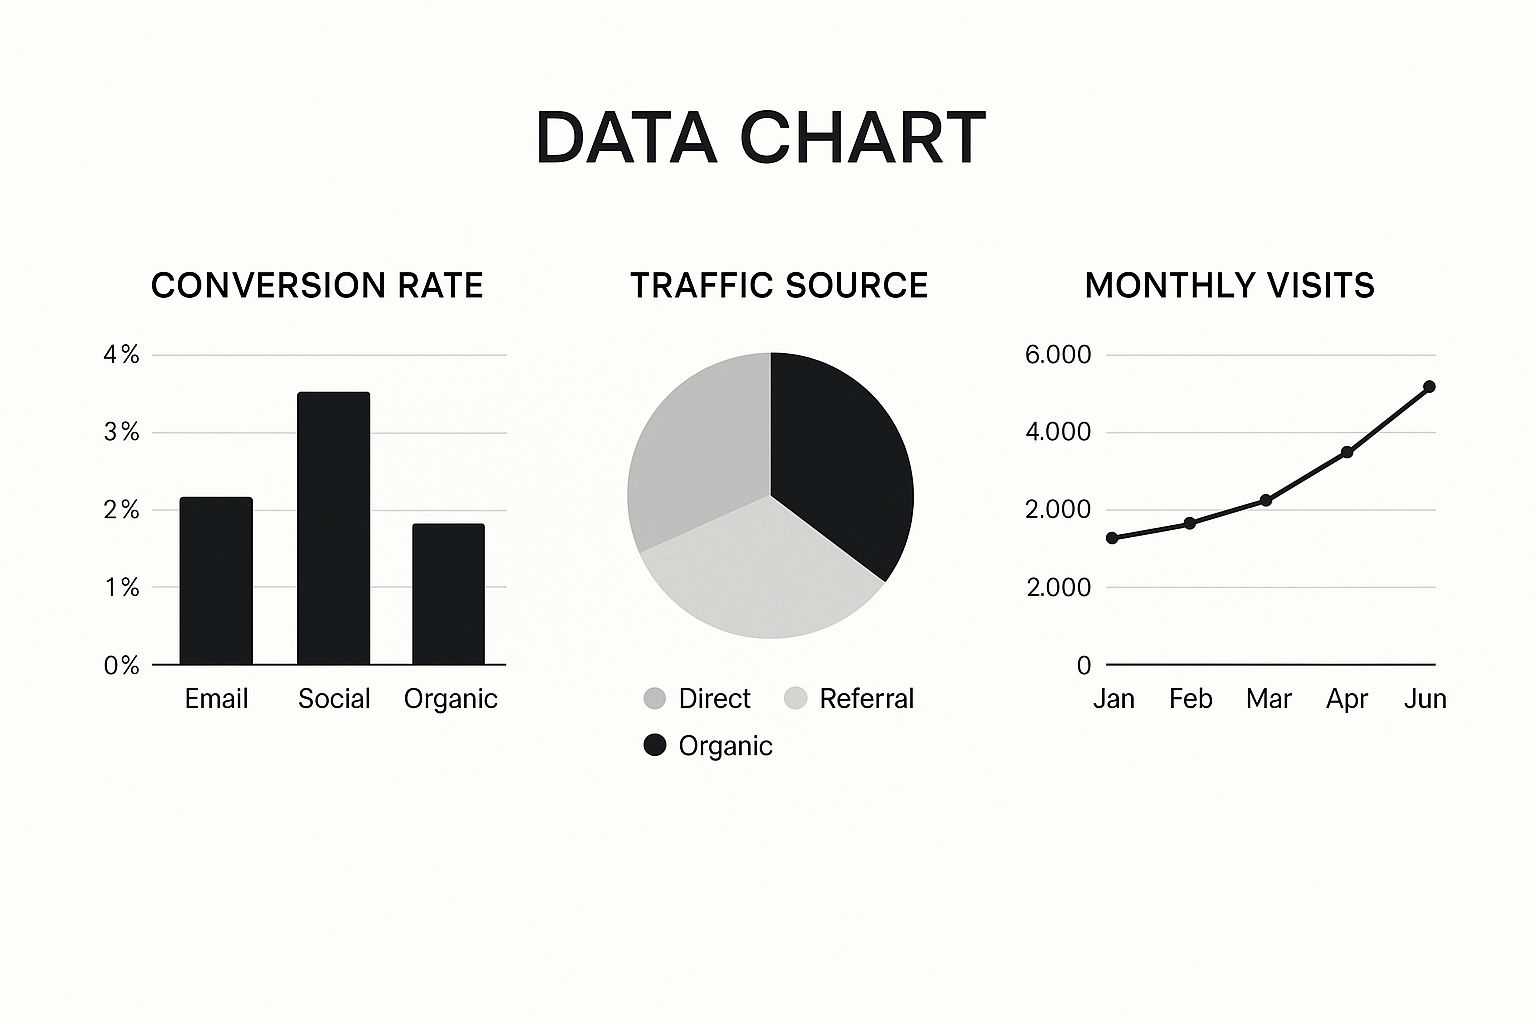
This kind of data immediately shows you which channels are your heavy hitters and how your growth is trending, giving you a real-time health check on your entire marketing engine.
Mapping Content Types to Key Conversion Metrics
To make your tracking even sharper, it helps to map different content formats to their most logical conversion goals. A blog post and a case study have very different jobs, so they should be measured differently.
The table below gives you a simple framework for aligning your content with the right metrics, ensuring you’re always measuring what matters.
When you align each piece of content with a clear business objective and the right metric, you build a powerful system for measuring success and optimizing your strategy for even better results.
Measuring Long-Term Loyalty and Customer Value
Conversions give you that immediate win, but the brands that last are built on loyalty. Great content doesn't just score a one-time sale; it earns a repeat customer. This is where we stop looking at single interactions and start digging into the content marketing metrics that track long-term value.
These are the numbers that tell you if you're building a real relationship. A conversion metric is like a great first date. A retention metric tells you if you’re building a partnership. It’s the difference between being a quick answer and becoming a trusted resource people have a reason to keep coming back to.
The Power of the Return Visitor
One of the cleanest signals of great content is your Return Visitor Rate. It’s simple: what percentage of your audience comes back after their first visit? It’s a powerful sign that your content is more than a one-and-done answer they found on Google. You've become a destination.
A high return visitor rate is proof you’re building an actual audience, not just renting fleeting traffic. These are the people who remember your name, trust your insights, and are way more likely to become customers down the road. It shows your content has made the jump from utility to habit.
Keeping Your Audience Subscribed
If you run on email lists or subscriptions, Subscriber Churn Rate is a vital health check. This number tracks the percentage of people who hit "unsubscribe" over a given period. It's the painful opposite of audience growth.
A little churn is normal, but a high, steady rate is a massive red flag. It usually points to a gap between what you promised and what you're delivering.
- Is your frequency off? Sending too much (or too little) can push people away.
- Is the quality consistent? One bad newsletter can be enough to lose someone for good.
- Are you still relevant? Your audience’s needs change. Your content has to evolve with them.
Watching your churn rate helps you find the leaks in your strategy, making sure you aren't losing people as fast as you're bringing them in.
Calculating the Ultimate Business Impact
At the end of the day, loyalty is about increasing the total value a customer brings to your business over time. That’s Customer Lifetime Value (CLV). And while it isn't strictly a content metric, your content is one of the best tools you have for boosting it.
CLV projects the total revenue you can expect from a single customer across their entire relationship with you. It proves that the first sale is just the beginning.
Great content is the glue that holds the customer relationship together long after the first sale. It drives repeat purchases, encourages upsells, and transforms one-time buyers into brand advocates, all of which dramatically increase CLV.
When you can prove your content is lifting the average CLV, you're showing a real, sustainable financial impact. It’s much bigger than a single campaign’s ROI. It proves you aren't just winning transactions; you're building valuable, long-term business assets. These retention-focused content marketing metrics are the proof.
Building Your Content Measurement Dashboard

All this knowledge is useless if you don't act on it. Now that we’ve walked through the key content marketing metrics, it’s time to pull them together into something you can actually use. A content measurement dashboard is your command center, turning raw data into clear, actionable insights that steer your strategy.
Think of it like the dashboard in your car. It doesn’t bother you with every mechanical detail. Instead, it shows you the critical info you need to drive safely and efficiently—speed, fuel, and engine warnings. Your content dashboard should do the same, cutting through the noise to focus on what really matters.
Start With Your Business Objectives
Before you track a single metric, you have to know what winning looks like for your business. A dashboard built without clear goals is just a pile of numbers without a story. So, start by asking the big questions.
What’s the main goal of our content? Is it to build brand awareness, generate qualified leads, keep customers around longer, or all of the above? Each of these goals requires a totally different set of metrics to track your progress.
Your dashboard should be a mirror of your business goals. If your top priority is generating leads, your lead generation and conversion rate metrics should be front and center, not your social media likes.
For example, a company trying to get its name out there might obsess over metrics like Share of Voice and organic traffic. On the other hand, a sales-driven organization is going to be laser-focused on Lead Generation, Conversion Rate, and Cost Per Acquisition (CPA).
Select a Balanced Mix of Metrics
A great dashboard tells the whole performance story, and that means mixing different kinds of indicators. To get a complete picture, you need to track both leading and lagging metrics.
- Leading Indicators: These are the forward-looking metrics that hint at future success. Things like social media engagement, email subscriber growth, and time on page suggest your content is hitting the mark, even before it starts making you money.
- Lagging Indicators: These are the backward-looking numbers that measure what already happened. Metrics like revenue generated, Customer Lifetime Value (CLV), and total conversions all fall into this bucket.
A healthy dashboard balances both. Leading indicators give you early warnings and chances to tweak your strategy, while lagging indicators confirm whether those tweaks are actually leading to real business results. An expert eye can make all the difference here, which is why many businesses turn to specialized partners. For instance, a focused approach like SaaS SEO consulting can help connect high-level strategy directly to metric selection and dashboard design.
Create Your Review Checklist
Your dashboard is only useful if you look at it. Set up a regular review cadence—whether it’s weekly or monthly—to analyze what’s happening and make data-informed moves.
A simple review process might look something like this:
- Review Consumption: Are we reaching the right people? Check Unique Visitors and your top Traffic Sources.
- Assess Engagement: Is our content actually resonating? Look at Average Time on Page and Shares.
- Analyze Conversions: Is our content driving action? Monitor Conversion Rate and Leads Generated.
- Identify Trends: What’s changed since last time? Make a note of any big spikes or dips.
- Define Next Actions: Based on everything you just saw, what are the top three things we’re going to do this month?
This kind of structured review turns your dashboard from a passive report into an active tool for getting better, making sure your content strategy is always delivering results you can measure.
A Few Common Questions About Content Metrics
Even with the best strategy in hand, a few questions always pop up around content marketing metrics. It's easy to get tangled in the weeds of measurement, but the answers are usually simpler than you think. Let's clear up a few of the most common hurdles marketers face.
What Are the Best Metrics for a Beginner to Track?
If you're just getting started, don't boil the ocean. Trying to measure everything at once is a surefire way to get overwhelmed and give up. Instead, focus on a handful of core metrics that give you the clearest picture with the least amount of noise.
Think of it as your starter pack. Nail these three first:
- Organic Traffic: This is your bread and butter. It shows you how many people are finding your content through search engines like Google. It’s the clearest sign your SEO efforts are paying off.
- Average Time on Page: Are people actually reading what you wrote? This metric tells you. If the number is painfully low, it’s a big red flag that your content isn't hitting the mark or engaging your audience.
- Newsletter Signups: This is a simple but incredibly powerful conversion metric. It proves your content is valuable enough that someone is willing to invite you into their inbox—a huge sign of trust.
How Can I Measure the ROI of Top-of-Funnel Content?
This is the million-dollar question. Measuring the return on investment (ROI) for something like a blog post is tricky because it rarely leads directly to a sale. The secret is to stop looking for a direct path and start tracking its influence on the entire customer journey.
Think of top-of-funnel content like an assist in basketball. It doesn't score the final points, but it's the critical pass that sets up the shot. Your job is to measure how well it moves the ball down the court.
To do this, you need to track the metrics that show early engagement and lead generation. Look at how many people who read a blog post eventually sign up for a webinar, download an ebook, or subscribe to your newsletter. By assigning a value to these "micro-conversions," you can start to piece together the content's financial contribution long before a deal closes.
How Often Should I Be Reviewing My Content Analytics?
The right cadence for checking your content marketing metrics really depends on your goals and how much content you're putting out. But for most teams, a monthly review is the sweet spot.
This rhythm gives your content enough breathing room to gain traction and lets real trends emerge from the data. A monthly check-in is perfect for analyzing performance, spotting your winners, and tweaking your strategy without getting whiplash from tiny daily fluctuations. The only exception? For a big campaign or a product launch, you might want to tighten that up to a weekly review.
At PimpMySaaS, we don’t just track these metrics—we turn them into growth. We help B2B SaaS companies get their voice heard in the conversations that matter, driving real business results from strategic engagement. See how we can elevate your presence at https://www.pimpmysaas.com.