
To really analyze log files, you have to turn that raw, chronological wall of text into something structured and searchable. It's a three-part dance: first, you parse the data to pull out the useful fields. Then you aggregate it all into one central spot. Finally, you query it to hunt down specific errors, patterns, or weird security events.
Mastering this process is what turns chaotic logs into clear, actionable insights.
Why Mastering Log File Analysis Is Non-Negotiable
Picture this: a key feature in your SaaS app is failing, but only sometimes. Users are getting frustrated, support tickets are flooding in, and you have zero clues. The only real record of what’s happening under the hood is buried in thousands of lines of log files scattered across a half-dozen servers.
This isn’t some textbook exercise. It’s a daily reality for developers, DevOps engineers, and security analysts.
Logs are the ground truth for your entire tech stack. They’re a running diary of every request, error, user action, and system event. Learning to analyze log file data isn't just a technical chore—it’s a core skill for debugging fast, tuning performance proactively, and keeping your systems secure.
The Real Value Hiding in Your Log Data
Without smart analysis, logs are just digital noise. But once you know how to read them, they give you incredible visibility. You can trace a single user's journey to finally replicate that impossible-to-find bug, spot a slow database query that’s been dragging down performance for weeks, or identify sketchy activity that points to a potential breach.
A well-analyzed log can be the difference between a five-minute fix and a five-day outage. It's no surprise the global log management market is expected to grow by USD 3,228.5 million between 2025–2029, all driven by businesses that get it.
To give you a better sense of the journey from raw data to real answers, here’s a breakdown of the core pillars involved.
The Core Pillars of Effective Log Analysis
This table summarizes the key stages you'll go through to transform messy log data into something truly useful.
Each pillar builds on the last, turning a stream of events into a powerful tool for troubleshooting and optimization.
This guide will walk you through the practical techniques you need to stop staring at a wall of text and start pulling out meaningful insights. We’ll cover everything from quick command-line tricks for one-off checks to building out sophisticated pipelines for large-scale analysis.
For example, understanding how bots like Googlebot hit your site can be crucial for SEO and performance analysis. You can even learn how to view a web page as Googlebot to make more sense of your access logs.
A log file is your system’s autobiography. It tells the complete, unedited story of its life—the wins, the struggles, and the screw-ups. Your job is to learn how to read it.
Whether you're fighting a fire in production or just trying to make things run a little smoother, the answers are almost always waiting in the logs. Let’s get started.
Quick Wins With a Little Command-Line Kung Fu
Before you spin up a whole logging pipeline, you can get surprisingly far with just your terminal. When a live issue pops up and you need answers now, command-line tools are your best friend. They're fast, powerful, and already sitting on pretty much every server you'll ever touch.
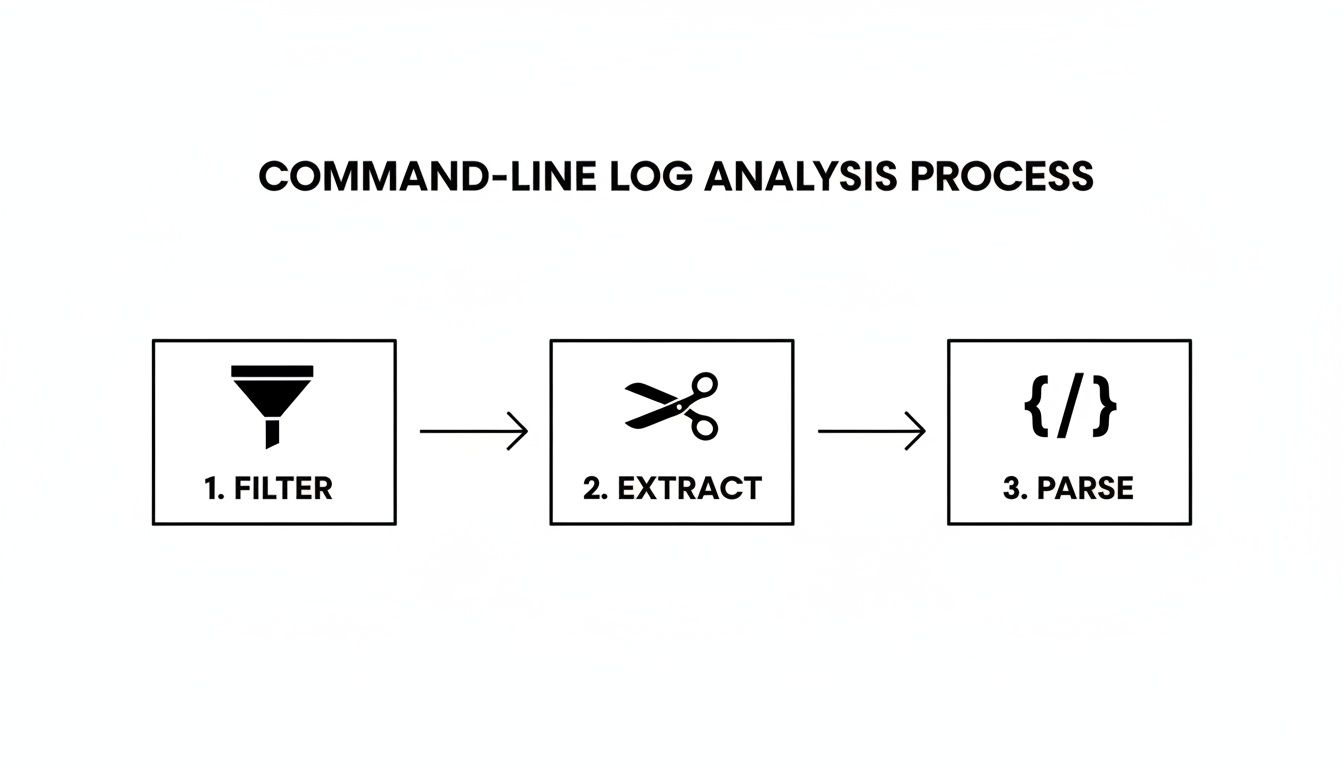
This approach is perfect for those down-and-dirty investigations where speed is everything. Let's walk through a few of the workhorses that can help you slice through the noise and find the signal in seconds.
Find Specific Errors With Grep
The grep command is the OG of text searching. Its entire job is to pull out lines that match a pattern you give it. Let's say your app is suddenly spewing 500 Internal Server Error responses, and you need to find every single one of them in your access.log.
It’s as simple as this:
grep " 500 " access.log
This command rips through access.log and spits out only the lines containing " 500 ". Adding the spaces is a neat little trick to avoid accidentally matching something like a request to /resource/5001.
But you can get way more specific with regular expressions. Need to find all client-side errors (any 4xx status code)? Try this:
grep -E '" (4[0-9]{2}) ' access.log
The -E flag tells grep to expect a more powerful regex pattern, making your searches incredibly flexible.
Extract and Summarize Data With Awk
While grep is a master of filtering, Awk is your go-to for chopping up and processing data that's laid out in columns. It reads a file line by line, splits each one into fields, and lets you perform actions on them. This is an absolute game-changer for summarizing log data on the fly.
Let's say you want to find the top IP addresses hammering your NGINX server. A typical access.log entry might look like this:192.168.1.1 - - [10/Oct/2023:13:55:36 +0000] "GET /api/v1/users HTTP/1.1" 200 500
With a single line, you can use awk to grab the IP address, count how many times each one appears, and sort them to see who your most frequent visitors are.
awk '{print $1}' access.log | sort | uniq -c | sort -nr | head -n 10
Here’s what that magical chain of commands is doing:
awk '{print $1}': Grabs only the first column (the IP address) from each line.sort: Groups all the identical IP addresses together.uniq -c: Counts how many times each unique IP shows up.sort -nr: Sorts the results numerically and in reverse (highest count first).head -n 10: Shows you just the top 10 results.
In one move, you've turned thousands of log lines into a clean summary of your top traffic sources.
Pro Tip: The real power comes from combining these tools. You can
grepfor errors first, then pipe those results intoawkto analyze just the bad requests. For example,grep " 500 " access.log | awk '{print $7}' | sort | uniq -cwill instantly tell you which URL paths are causing the most server errors.
Parse JSON Logs With Jq
Modern apps love to log in JSON. It’s structured and machine-readable, but trying to parse it with line-based tools like grep or awk is a nightmare. This is where jq saves the day. It's a lightweight and ridiculously powerful command-line JSON processor.
If your app.log is full of JSON entries like {"level":"error", "message":"User authentication failed", "userId":123}, you can query it with ease. To pull out just the error messages, you’d run:
cat app.log | jq 'select(.level == "error") | .message'
This command tells jq to find all the JSON objects where the level key is "error" and then print out the value of the message key for each one. It turns a dense wall of JSON into a clean, readable list of exactly what went wrong.
Structuring Chaos With Log Parsing And Aggregation
Command-line tools are fantastic for quick, surgical strikes on a single machine. But they hit a wall fast in a distributed world. When you’ve got logs scattered across dozens of servers, containers, and services, ssh-ing into each box to grep for an error isn't just tedious—it's impossible.
This is where centralized logging and parsing change the game.
The goal is to funnel everything into a single, unified stream. Instead of chasing down logs one by one, you bring them all to one place. A crucial first step is solid data integration, which lets you merge all those different log sources into one cohesive view.
This process is what turns raw, unstructured text into structured, queryable data—setting you up for much deeper insights.
Each of these stages refines the data, making it more valuable for troubleshooting and analysis down the line.
Choosing Your Log Processing Engine
To build this kind of pipeline, you need a tool that can collect, transform, and forward your logs. These are often called log shippers or processors, and a few popular open-source options dominate the space: Logstash, Fluentd, and Vector.
Each one comes with a different philosophy and set of strengths.
- Logstash: As part of the famous ELK Stack (Elasticsearch, Logstash, Kibana), it’s incredibly powerful and boasts a massive plugin ecosystem. It’s perfect for complex data transformations but can be a bit of a resource hog.
- Fluentd: Known for its flexibility and reliability. It has a smaller footprint than Logstash and uses a unified logging layer to make connecting different data sources and destinations feel seamless.
- Vector: A newer, high-performance tool written in Rust. It’s built from the ground up for speed and efficiency, acting as a lightweight and seriously fast agent and aggregator.
To give you a better idea, here's a quick rundown of where each tool shines.
Log Shipper and Parser Comparison
Choosing the right tool really depends on your existing stack, performance needs, and how much complexity you're willing to manage.
The Economic Case for Centralized Logging
Handling massive log volumes isn't just a technical challenge; it's an economic one. It’s common for enterprises to ingest terabytes—or even petabytes—of log data every month. Raw log streams in data-heavy businesses often grow by 20–50% year over year.
A centralized architecture is the only sane way to manage these costs. It lets you implement smart filtering, sampling, and retention policies to keep things under control.
Centralizing logs isn’t just about convenience; it’s about control. It lets you apply consistent parsing rules and retention policies, ensuring data quality and managing costs effectively at scale.
This structured approach is also fundamental to other technical tasks. Just as parsing logs gives structure to event data, you also need to make sure search engines can properly parse your site’s structure. With a solid foundation, you can move from just collecting logs to actively uncovering the patterns and anomalies hidden inside them.
Uncovering Patterns and Anomalies in Your Data
Once your logs are parsed and actually flowing into a central hub like the ELK Stack, the real fun begins. You can finally shift from being reactive—scrambling when something breaks—to proactively hunting for the subtle patterns and odd blips that signal trouble long before users start complaining.
This isn't just about finding specific errors anymore. It's about spotting trends.
That shift from reactive to proactive is a game-changer for stability and security. We've seen companies that get serious about log analysis slash their mean time to detect (MTTD) and mean time to respond (MTTR) by 30% to 60%. Faster detection means smaller outages and quicker recoveries. You can dig into more of these findings in the log management software market report.
Writing Queries That Reveal Insights
With your data neatly structured in Elasticsearch, Kibana becomes your new best friend. This is where you can slice and dice your log data using the Kibana Query Language (KQL) in ways that just aren't possible with grep.
Simple keyword searches are fine, but the real power comes from building queries that aggregate and filter. Let’s walk through a few real-world scenarios using web server logs from a typical SaaS app.
Counting HTTP Status Codes: You need a quick pulse check on your application's health. A simple query can give you a high-level count of status codes.
http.response.status_code: *
Run this, and you can instantly visualize the results in Kibana as a pie chart. Suddenly, you can see the ratio of healthy200s to client-side4xxerrors and critical5xxserver errors.Identifying Spikes in Server Errors: A sudden jump in
5xxerrors is a massive red flag. To zero in on these, you can filter for just that range and track the count over time.http.response.status_code: [500 TO 599]
Plotting this on a timeline makes it painfully obvious if a recent deployment or config change unleashed a wave of failures.Tracing a User's Session: When a user reports a bug, you need to see their entire journey. If you’re logging a user ID, you can reconstruct their whole session, from login to the moment things went sideways.
user.id: "12345"
This query isolates every log entry for that specific user, letting you follow their requests in chronological order and pinpoint exactly where the process broke down.
Key Takeaway: The best queries don't just find a single log line. They pull together data over time to reveal the trends, spikes, and outliers that are completely invisible when you're just staring at raw text files.
Visualizing Data to Spot Anomalies
Let's be honest—humans are visual. A line chart showing a sudden, sharp spike in API response times tells a much clearer story than scrolling through thousands of text lines. This is where Kibana really shines, turning your query results into dashboards you can actually understand.
The screenshot below gives you a sense of what a typical Kibana dashboard looks like. It’s a mix of maps, charts, and data tables that give you a bird's-eye view of what's happening.
With a dashboard like this, you can spot unusual activity at a glance. What might take you hours to piece together from raw logs becomes obvious in seconds.
Automating Log Analysis for Proactive Insights

Running queries by hand is great when you’re actively hunting down a problem. But its real power? It shows you exactly what you need to automate.
The endgame here isn't to get better at firefighting; it's to build a system that watches your logs for you. This is how you shift from reacting to failures to proactively solving issues before they ever hit your users. Automation turns your log analysis from a chore into a genuine safety net for your entire stack.
Building Health Check Dashboards
Your first step into automation should be visualization. Think of it as your mission control. A well-designed dashboard gives you an at-a-glance health check of your system, saving you from running the same grep and awk commands over and over.
Tools like Kibana or Grafana are perfect for this. You can build out live dashboards that display your most critical metrics in real time.
Here are a few widgets I always include:
- Error Rate Trends: A simple timeline tracking 5xx and 4xx status codes. If that line starts climbing, you know something’s wrong.
- Response Time Percentiles: Forget averages. p95 and p99 response times tell you the real user experience and are the first indicators of performance decay.
- Log Volume by Service: Is one of your microservices suddenly screaming logs? This chart makes it obvious.
- Top Slowest API Endpoints: A leaderboard of shame. This table shows you exactly where your performance bottlenecks are.
Getting a handle on these metrics is fundamental to managing a healthy system, a discipline that shares a lot of DNA with web analytics consulting.
Configuring Actionable Alerts
Dashboards are for passive observation. Alerts are for proactive intervention.
A good alerting strategy isn't about spamming a Slack channel. It's about sending the right information to the right person at the right time. The goal is to create high-signal, low-noise alerts that your team actually pays attention to.
An alert without context is just noise. A great alert tells you what's broken, how it's broken, and what the immediate impact is, empowering your team to act decisively.
Hook your logging platform up to something like Slack or PagerDuty. Then, set up alerts for specific, meaningful conditions. For example, if the count of 401 Unauthorized errors from your payment gateway jumps past 10 in a five-minute window, that’s not a random blip—it could be a misconfigured key or something worse. That’s an alert worth waking someone up for.
For a deeper dive into this, it's worth exploring dedicated monitoring and observability tools that have these kinds of intelligent alerting features built-in.
Scripting for Deeper Analysis
Finally, some questions are too complex for a dashboard widget. For those deep-dive investigations, scripting is your best friend.
Using a language like Python with the Elasticsearch library, you can schedule complex analytical jobs to run in the background. Imagine writing a script that runs every night, pulls all user sign-up failures from the past 24 hours, and groups them by error type.
This kind of automated report can surface subtle bugs in your registration flow that you'd otherwise miss for weeks. It’s how you analyze log file data with a level of depth and consistency that manual checks could never match.
A Few Common Questions About Log Analysis
As you dig deeper into log analysis, a few questions always seem to pop up. Moving from quick command-line checks to a more organized system brings its own set of challenges, whether it's dealing with a flood of data or just figuring out what's actually important. You're not alone in asking these.
Let's clear up some of the common hurdles and offer some practical advice for engineers at any level.
SaaS vs. Open-Source Logging Tools: Which Is Better?
This is the classic convenience vs. control debate. There’s no universal right answer here—it really comes down to your team’s resources, expertise, and priorities.
SaaS Solutions (e.g., Datadog, Sematext, Splunk): These platforms are managed for you. You get powerful tools right out of the box with almost no setup or maintenance. The trade-off is cost, which can get steep as your log volume grows, and you give up some control over the infrastructure.
Open-Source Solutions (e.g., ELK Stack, Grafana Loki): Going this route gives you total flexibility. You can tune everything to your specific needs and you’re not locked into a vendor. The catch? You’re responsible for everything: setup, maintenance, scaling, and security. That's a serious engineering commitment.
For most small to mid-sized teams, starting with a SaaS tool is usually the more practical move. It lets you get value from your logs immediately instead of sinking time into managing yet another complex piece of infrastructure.
How Do I Manage Enormous Log Volumes?
When you’re staring down terabytes of data, you can't just dump it all into storage and cross your fingers. The key is to manage log volume strategically without losing the critical signals hidden inside. Smart logging is about collecting the right data, not all the data.
First, be selective at the source. Make good use of log levels like INFO, WARN, and ERROR. In a stable production environment, you probably don't need to log every single successful database query. Dialing down the verbosity can make a huge difference.
Another powerful move is log sampling. For high-volume, low-stakes events like HTTP 200 OK responses, you might only need to store a small fraction to see the trend. For critical errors, however, you'll want to keep 100%. This tiered approach slashes storage costs while making sure the most important signals always get through.
What Are the Most Critical Metrics to Monitor?
It's incredibly easy to get swamped when you first analyze log file data. To cut through the noise, you need to zero in on the metrics that directly impact your application's health and, more importantly, your users' experience.
Here are three essentials to get you started:
- Error Rates: Keep a close eye on the count and percentage of 5xx (server errors) and 4xx (client errors). A sudden jump here is the clearest sign that something is broken.
- Response Time Percentiles (p95/p99): Forget average response time; it lies. The 95th and 99th percentiles reveal what your slowest users are actually experiencing, which is a far better gauge of performance issues.
- Request Throughput: Track requests per second or minute. An unexpected drop could mean trouble with an upstream service or network issue. A massive spike? You might be looking at a DDoS attack or a buggy client gone wild.
Monitoring these three indicators gives you a solid, no-nonsense baseline for understanding your system's health.
At PimpMySaaS, we specialize in cutting through the noise to get your brand noticed where it counts—in high-value Reddit discussions and AI-powered search results. We help B2B SaaS companies become the go-to answer in their niche. Learn more about our approach at https://www.pimpmysaas.com.