
Forecasting SEO traffic is all about using your past performance and keyword data to make an educated guess about your future organic growth. At its simplest, you're multiplying a keyword's search volume by an expected click-through rate (CTR) to get a rough idea of the traffic you could win.
But it’s so much more than a simple formula.
Why SEO Traffic Forecasting Is Crucial

Let's be real: forecasting isn't just a nerdy spreadsheet exercise. It's what turns SEO from a reactive, "let's hope this works" channel into a predictable engine for business growth.
Without a solid forecast, you're flying blind. You have no real way to connect your team’s hard work to tangible business outcomes like leads, trial signups, or actual revenue. Before you even think about building models, it helps to have a firm grasp of what SEO is in digital marketing to understand the moving parts.
This is especially true when you need to justify your budget. It’s one thing to ask for resources; it’s another to walk into a meeting with a data-backed projection showing a 20% increase in organic leads from a new content strategy. That’s how you get buy-in.
The benefits go way beyond just getting your budget approved:
- Smarter Prioritization: A forecast shows you which keywords or content pillars have the highest potential return, so you can stop wasting time and focus your efforts where they'll actually move the needle.
- Real Performance Benchmarking: It gives you a clear baseline to measure your actual results against. This makes it dead simple to spot what’s working and diagnose problems early.
- Proactive Strategy: You can see seasonal trends or market shifts coming, letting you adjust your game plan before you fall behind the competition.
Aligning Methods With Your Goals
The most reliable forecasts don’t just pick one method; they blend historical data with keyword-based projections to get the full picture.
Statistical methods, for example, lean on your own past performance data from Google Search Console and Analytics to project a baseline trend. This is your "business as usual" growth trajectory. On the other hand, keyword-based models look at the opportunity out there. The classic formula is pretty straightforward:
Estimated Monthly Traffic = Total Keyword Search Volume × Average CTR
So, if you’re targeting a keyword with 8,000 monthly searches and you realistically think you can hit a position with a 1% CTR, you're looking at an estimated 80 sessions per month from that term alone. The catch? These models can get thrown off by things like algorithm updates or a major site redesign, which is why you can't rely on them in a vacuum.
To get a better sense of which approach to use and when, here’s a quick breakdown.
Comparison Of Forecasting Methods
Forecasting isn't a one-size-fits-all game. The method you choose depends entirely on your goals, the data you have available, and how much precision you really need.
Ultimately, a hybrid approach almost always wins. It keeps your ambitious goals tethered to the reality of your site's actual performance.
The key is to blend the art and science. Historical data tells you where you've been, while keyword analysis illuminates where you could go. The magic happens when you use both to create a realistic, actionable roadmap.
For B2B SaaS companies, this becomes mission-critical. Forecasting helps you map content creation directly to the sales funnel—from top-of-funnel blog posts that attract awareness to bottom-of-funnel optimizations on your pricing page. You can dive deeper into this specialized strategy in our guide to SEO for SaaS companies.
When you can connect traffic projections to trial signups and MQLs, SEO stops being a cost center and starts being a predictable revenue driver. And that’s a conversation every founder wants to have.
Getting Your SEO Data Ready for Forecasting
Any traffic forecast is only as good as the data you feed it. Without clean, reliable historical numbers, you’re just making educated guesses—and those guesses can easily send your entire strategy off course. The mission here is to pull together a complete record of your website's performance, warts and all.
You'll start with the tools you're already in every day. The first stop is Google Analytics 4 (GA4) for your organic sessions and conversions, paired with Google Search Console (GSC) for the SERP-level truth on clicks, impressions, average position, and CTR. These two are your non-negotiables.
Next, you need to layer in data from your rank tracking tool. GSC gives you averages, which are useful but can hide important details. A dedicated rank tracker like Ahrefs or Semrush gives you daily, specific keyword positions, which is absolutely crucial for seeing the momentum behind your most valuable terms.
Assembling Your Historical SEO Dataset
To build a model that actually works, you need enough runway. I always aim for at least 16-24 months' worth of historical data. That's the sweet spot—it’s long enough to catch seasonality, map out long-term growth trends, and account for the impact of past algorithm updates or major site changes.
Here’s a typical GA4 view you'd use to start pulling your numbers.
This is where you'll isolate the "Organic Search" channel, which is your jumping-off point for exporting the historical traffic data you'll need.
Your goal is to create a master dataset with a few key metrics:
- Organic Sessions: The raw traffic numbers from GA4.
- Impressions & Clicks: Your core visibility metrics, pulled straight from GSC.
- Average Position: Also from GSC, giving you that high-level look at where you stand.
- Keyword Rankings: Specific, daily position data from your rank tracker for your money-making keywords.
- SERP Feature Ownership: Are you winning featured snippets? People Also Ask boxes? Don't forget to track this.
A forecast is only as strong as its weakest input. Taking the time to meticulously gather and clean your data is the single most important step. It isn't glamorous, but skipping it guarantees you'll get garbage-in, garbage-out results.
Cleaning And Normalizing Your Data
Raw data is never ready to go. It’s messy. It’s full of outliers and weird inconsistencies that will absolutely wreck your forecast. The cleaning process is where you fix all that, ensuring your model learns from a history that makes sense.
First up, tackle the outliers. Did a massive Google update cause a sudden, uncharacteristic traffic drop? Did tracking break for a week because of a botched GTM deployment? These aren't normal performance fluctuations, so they need to be flagged or smoothed out. For example, if a core update in May caused a 30% traffic drop, you need to document that event so your model doesn't mistake it for a regular seasonal dip.
Next, you have to deal with missing data. Gaps happen—tracking outages, import errors, you name it. Don't just leave them blank. A simple way to fill them is to take the average of the periods right before and after the gap. This prevents the missing values from throwing off your calculations.
Finally, make sure all your data sources are speaking the same language. If you're pulling monthly data from GA4 but weekly data from your rank tracker, you have to standardize everything to the same time interval—usually monthly—before you can combine them. Getting this foundation right can be tricky, and it's often where bringing in a web analytics consulting expert can save you from building your forecast on shaky ground.
The Power of Data Segmentation
One of the biggest mistakes I see is treating all organic traffic as one giant blob. It isn't. Different parts of your site behave in completely different ways. Segmenting your data before you start forecasting is the secret to unlocking a much higher degree of accuracy.
Think about it: a high-value keyword that's climbed from position 45 to 19 over the last year has a ton of upward momentum. Hitting Page 1 is a realistic goal. But a hyper-competitive head term might take months just to move up a few spots. By modeling these segments separately, your forecast becomes far more realistic.
You should be breaking down your data by:
- Page Type: Blog posts, product pages, and solution pages all have unique traffic patterns and conversion goals.
- Content Hub or Topic Cluster: Grouping related articles helps you forecast the impact of building out topical authority.
- Search Intent: Your informational, commercial, and transactional keywords will perform very differently. Model them that way.
When you prepare your data with this level of detail, you move beyond a vague, site-wide guess. You end up with a nuanced, genuinely useful forecast that can actually guide your SEO strategy.
Choosing Your SEO Forecasting Method
Alright, you’ve got your data wrangled and cleaned up. Now comes the interesting part: picking the right tool for the job.
There’s no single “best” forecasting model. The right approach really depends on your website's history, the specific question you're trying to answer, and the quality of the data you have. Think of it like building a toolbox, not searching for one magic wrench.
You wouldn’t use a sledgehammer to hang a picture frame, right? In the same way, you don't need a complex ARIMA model for a brand-new blog with only three months of traffic data. The goal is to match the method to the moment.
Simple Models for a Solid Baseline
For most day-to-day forecasting, the simplest models are often the most practical. They give you a quick, reliable baseline without getting bogged down in statistical complexity.
Trend Extrapolation (Linear Regression): This is forecasting in its purest form. It literally draws a straight line through your historical traffic data to project where things are headed. It’s perfect for sites with steady, predictable growth but will miss the mark if your traffic has seasonal swings or is prone to sudden market changes.
Exponential Smoothing: This is a smart step up from a basic trendline. It gives more weight to your most recent data, working on the assumption that what happened last month is a better predictor of next month than what happened two years ago. This makes it much more responsive to recent shifts in your growth curve.
These two methods are your workhorses. They're great for establishing a "business as usual" trajectory—answering the fundamental question, "If we do nothing different, where will our traffic be in six months?"
The workflow for any of these models starts with solid data prep, as this decision tree shows.
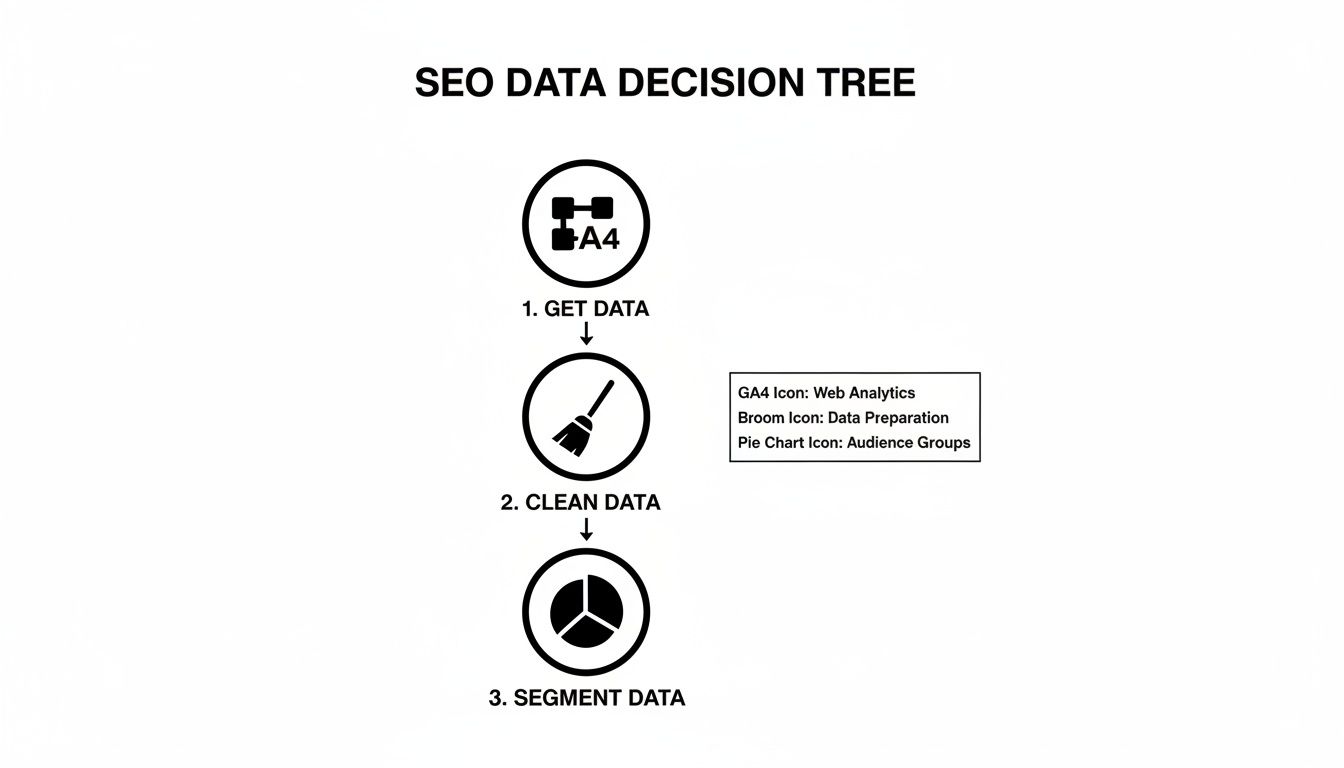
Getting this part right—the collection, cleaning, and segmentation—is the non-negotiable foundation for any accurate forecast.
Advanced Models for More Nuanced Predictions
But what if your traffic patterns aren't so simple? For businesses with more complexity, you’ll need a model that can keep up.
Seasonal Decomposition: This is a must-have for any business with predictable peaks and valleys. Think e-commerce sites gearing up for Black Friday or a travel blog that spikes in the summer. This technique unpacks your traffic data into three clean components: the underlying trend, the seasonal pattern, and the random "noise." By forecasting each piece separately, you get a far more accurate picture of the future.
ARIMA (Autoregressive Integrated Moving Average): Now we're getting into the heavy hitters. ARIMA is a powerful time-series model that analyzes past data points to predict future ones. It's incredibly effective for mature websites with years of clean historical data, as it can capture subtle, complex patterns that simpler models just can't see. The catch? It requires a lot of good data and a solid grasp of statistics to tune it correctly.
Expert Tip: Don't mistake complexity for accuracy. I’ve seen a well-tuned seasonal model outperform a sloppy ARIMA forecast time and time again. Always start with the simplest model that can explain the core patterns in your data. Only add complexity when you absolutely need it.
SEO Forecasting Model Features
To help you decide, here’s a quick breakdown of the most common models and what they bring to the table.
This table should give you a good starting point. For most teams, starting with Exponential Smoothing or Seasonal Decomposition is the sweet spot between accuracy and effort.
Tying Forecasts to Business Goals
Here’s where forecasting moves from a technical exercise to a strategic one. A pure statistical projection is interesting, but connecting that traffic to actual business outcomes—like trial signups, leads, or revenue—is what gets you budget and buy-in.
The most direct way to do this is with keyword-based forecasting. This model uses search volume and estimated click-through rates (CTR) to project potential traffic from your content efforts. It's fantastic for showing the tangible impact of targeting a new keyword cluster.
For example, if you're going after a group of keywords with a combined search volume of 50,000, and you realistically aim for an average CTR of 2% in the top 5, you can project around 1,000 new sessions per month. Even a conservative goal of reaching position 8, which often yields a 1% CTR, gives you a baseline to work with. The real power here is in quantifying the upside of your SEO work, turning abstract goals into concrete numbers.
From that foundation, you can build even more powerful, context-rich models:
Cohort-Based Forecasting: Instead of looking at total traffic, this approach groups users by when they first found your site. A SaaS business could track what percentage of the "January cohort" converts to a trial within their first 30 days. This creates a direct link between traffic acquisition and user activation, making it invaluable for predicting signups.
Funnel-Conversion Adjusted Models: This model takes a keyword forecast and layers on your historical conversion rates for each stage of the marketing funnel. It lets you answer the questions your CFO is asking, like, "If we secure top rankings for these 10 bottom-of-funnel keywords, how many MQLs will that generate?" This is how you start speaking the language of the C-suite. While the context is different, many of the principles from various sales forecasting techniques can be adapted here to help you think through different methodological approaches.
Building Your SEO Forecasting Templates
Theory is one thing, but turning it into a practical, repeatable process is where the real value lies. This is where a solid forecasting template comes in. A well-built template doesn't just save you a ton of time; it forces a level of consistency and accuracy into your projections that you just can't get from one-off analyses.
Whether you're more comfortable in a spreadsheet or you prefer the power of a coding environment, the goal is the same: build a reusable asset that turns raw data into a strategic roadmap.
The real beauty of a good template is that it handles all the repetitive, heavy lifting. This frees you up to spend your time on what actually matters—interpreting the numbers, running different scenarios, and telling a clear story to your team or your clients.
Crafting a Google Sheets Forecasting Template
For most of us, Google Sheets is the perfect place to start. It's accessible, built for collaboration, and honestly, it’s more than powerful enough for the vast majority of statistical forecasting needs. The trick is to structure your sheet for clarity and easy updates, making sure you keep your raw data, your calculations, and your final dashboard completely separate.
A bulletproof Google Sheets template should always have these distinct tabs:
- Data Import: A clean, dedicated tab where you just paste the raw export from Google Search Console. That’s it. Don't touch it, don't format it. This keeps your source data pristine.
- Data Processing: This tab pulls from your import sheet to clean things up. Here, you’ll use formulas to aggregate daily clicks into monthly totals and get everything ready for the model.
- Forecasting Model: This is the engine room. It’s where you’ll use functions like
FORECAST.LINEARor build out your more complex calculations for things like seasonal adjustments. - Dashboard: A clean, visual summary of the forecast. This tab should be all about charts and key metrics that are easy to understand at a glance and simple to screenshot for your reports.
I always build my sheets with a clear separation between "inputs" and "outputs." All the manual data drops happen in one spot, and the rest of the sheet just updates automatically. It’s a simple discipline, but it prevents you from accidentally overwriting a critical formula and turns monthly updates into a five-minute job.
For a simple trend line, the FORECAST.LINEAR(x, data_y, data_x) function is your best friend. In this formula, x is the future date you're predicting, data_y is your range of historical traffic data (like clicks), and data_x is your range of historical dates. The function basically runs a linear regression for you, giving a solid baseline projection for sites with relatively steady growth.
Handling seasonality is a bit more involved. You first need to calculate a year-over-year growth rate and then apply a seasonal index to it. For example, if you know your traffic in January is consistently 15% lower than the annual average, you’d apply a 0.85 multiplier to your January forecast to make sure it accounts for that predictable dip.
Leveraging Python for More Advanced Forecasting
Once your data gets messy or you need to run more sophisticated models like ARIMA, it’s time to graduate from spreadsheets. An environment like a Jupyter Notebook is the next logical step. Python, with incredible libraries like pandas for data manipulation and statsmodels for statistical modeling, gives you a much higher ceiling for both customization and accuracy.
The workflow in Python pretty much mirrors the spreadsheet approach, but each step is way more powerful.
- Data Loading: Use pandas to read your GSC data from a CSV file straight into a DataFrame.
- Data Cleaning: Handle missing values, convert date columns to the right format, and resample daily data into monthly totals with just a few lines of code.
- Modeling: This is where Python really shines. You can implement exponential smoothing or a full-blown ARIMA model with
statsmodels, which can automatically detect seasonality and trends for you. - Visualization: Use libraries like Matplotlib or Seaborn to create polished, publication-quality charts that show your historical data, the forecast, and those all-important confidence intervals.
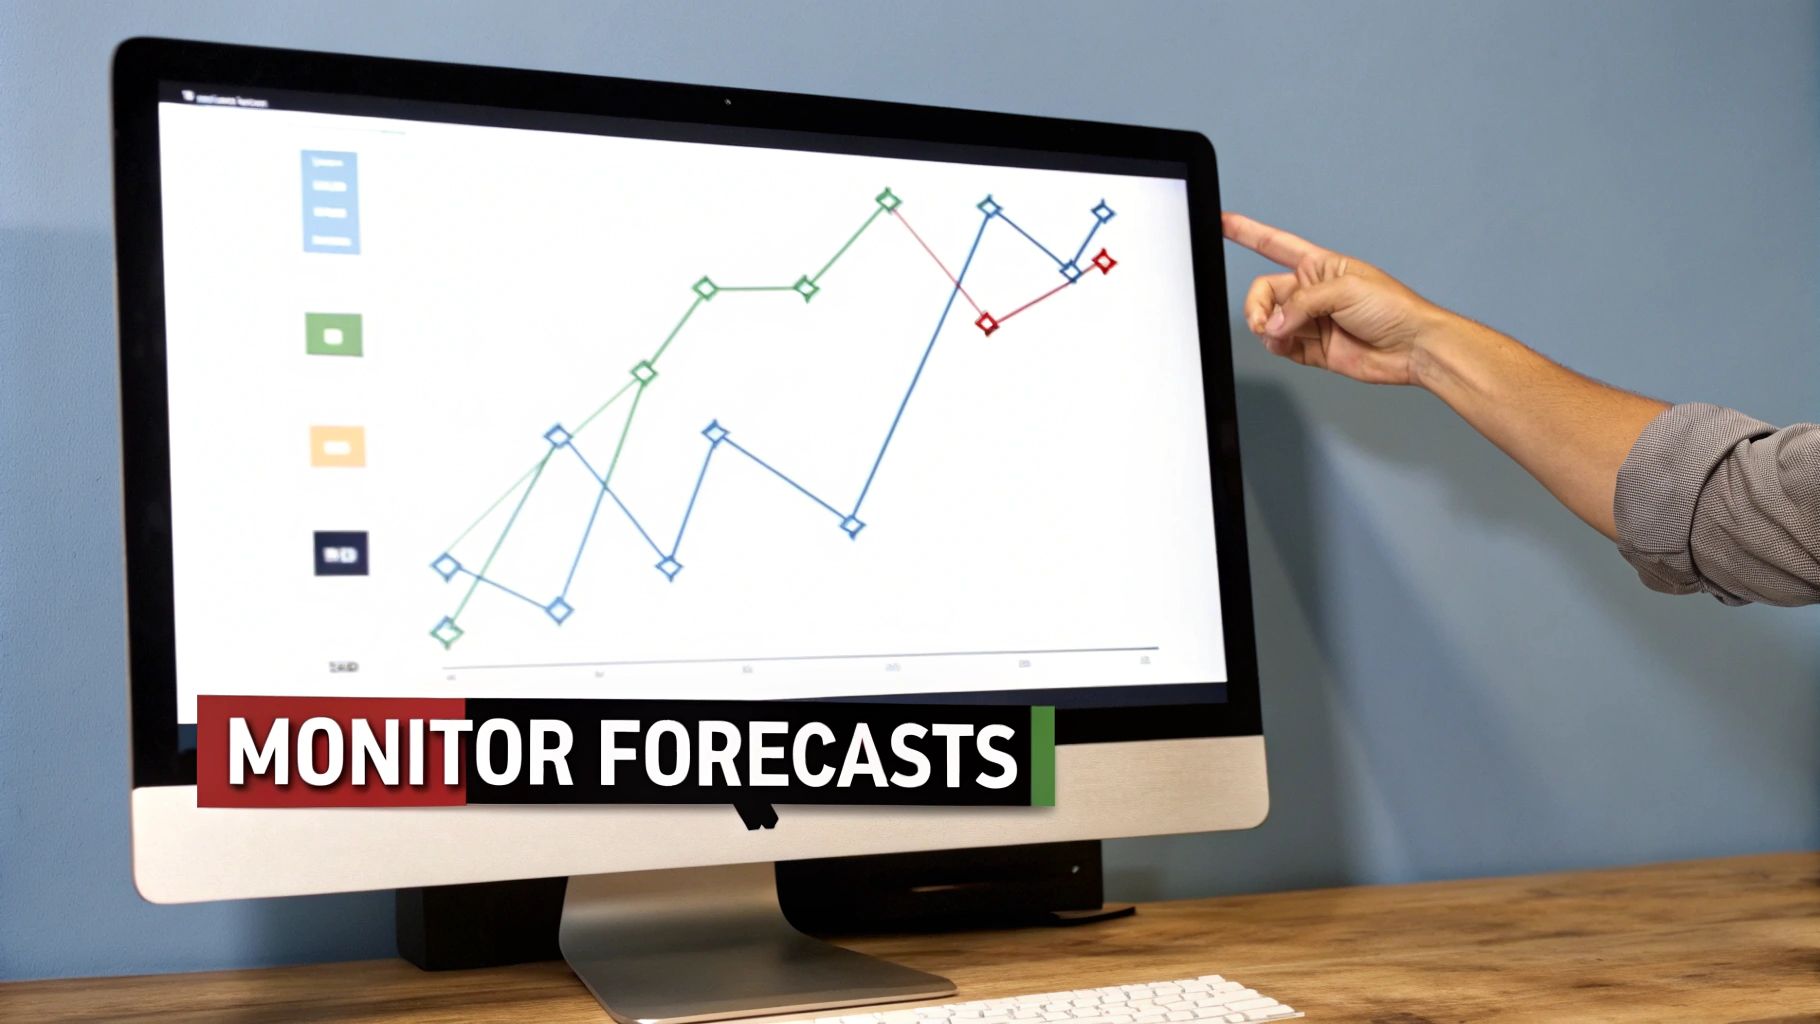
Here’s what a simple time-series forecast looks like when plotted from a Python notebook.
This visual output is so much clearer than a spreadsheet. It shows the historical clicks in blue, with the model's prediction and the confidence interval for the forecast period shaded in gray. Being able to visualize that range is critical for communicating that a forecast is a probability, not a guarantee.
Customizing Your Templates for Actual Business Goals
A generic traffic forecast is nice, but a forecast tied to real business metrics is a game-changer. Your templates need to be flexible enough to project more than just clicks.
For a SaaS business, you could customize your template to:
- Forecast Trial Signups: Apply your historical click-to-trial conversion rate to your traffic forecast to project how many new users you can expect to onboard.
- Project Pricing Page Visits: Isolate the historical traffic to your pricing page, forecast its growth, and use that as a leading indicator for sales-qualified leads.
- Estimate Content ROI: For keyword-driven forecasts, layer in your average conversion rate and customer lifetime value. Suddenly, you can attach a real revenue figure to your content plan.
For instance, your formula might be as simple as: Forecasted Revenue = (Forecasted Traffic × Avg. Conversion Rate) × Avg. Revenue per Conversion. Building this logic directly into your template transforms your SEO report from a traffic summary into a compelling business case. This modular approach lets you plug different goals into your core traffic model, making your forecasting SEO traffic efforts directly relevant to what the business actually cares about—growth.
Validating Scenarios And Monitoring SEO Forecasts
Creating a forecast is only half the battle. A projection is useless if it just sits in a static spreadsheet, gathering dust. The real value comes from treating it like a living document—something you constantly validate, stress-test, and measure against what’s actually happening.
This ongoing process turns your forecast from a one-time guess into a dynamic tool. It’s what keeps your SEO strategy sharp, accountable, and tied directly to business goals.
Stress-Testing Your Forecast With Scenarios
Your baseline forecast is your best guess at the most likely outcome, but reality is rarely that simple. SEO traffic doesn't grow in a perfect, straight line. To prepare for the inevitable bumps and boosts, you need to run scenarios that map out the full range of possibilities.
This isn’t just a technical exercise; it forces you to connect effort to outcome and builds huge trust with stakeholders. You’re not just handing them a single, optimistic number. You’re showing them a thoughtful range of what could happen and why.
Expected Case: This is your primary forecast. It’s built on your current trajectory and assumes your content plan stays on schedule and your team has the resources it needs.
Best Case (Aggressive): What happens if everything goes right? Maybe a new content cluster takes off faster than expected, or a PR campaign lands a few high-authority backlinks. Modeling a +20% or +30% adjustment shows the potential upside and helps justify those ambitious goals.
Worst Case (Conservative): Now, what if things go wrong? Budget cuts could slow down content production, or a key team member goes on unexpected leave. Applying a -10% or -15% adjustment gives you a realistic floor, helping you manage expectations and build contingency plans.
A forecast without scenarios is just a guess. By modeling a range of outcomes, you move from making a single prediction to preparing for multiple futures. This honesty helps your team make better decisions and earns critical buy-in.
Backtesting Your Model For Accuracy
Before you can trust a model to predict the future, you have to prove it can accurately explain the past. This process is called backtesting, and it’s a crucial step that far too many people skip.
The concept is simple. Take your historical data, but pretend the last six months never happened. Run your forecast for that six-month period and then compare the model's predictions to what actually occurred.
If your forecast was within 5-10% of the actual traffic, your model is probably solid. If the variance is much larger, it’s a red flag. Your model might be too simple, failing to account for seasonality, or it could be overly sensitive to past outliers. This quick check ensures your forecasting SEO traffic methodology is sound before you start making big strategic decisions based on it.
Setting Up Proactive Monitoring And Alerts
A forecast shouldn't be a dusty artifact you pull out for quarterly reports. It should be a core part of your weekly operational rhythm. The best way to do this is by building a simple monitoring dashboard and setting up automated alerts.
Your goal here is to create an early warning system. You want to know immediately when your actual performance deviates from your forecast—whether it's good news or bad.
A weekly dashboard in Google Looker Studio or even a simple chart in your forecasting spreadsheet should track two key lines:
- Forecasted Traffic: The projected number of clicks or sessions.
- Actual Traffic: The real performance data pulled from Google Search Console.
Set up an alert to trigger if actual traffic deviates from the forecast by more than a set threshold, like +/- 15% for two weeks straight. This gives you a nudge to investigate right away. A positive deviation might mean a new content piece is crushing it, while a negative one could signal a technical issue or a drop in rankings.
This proactive approach is especially vital for SaaS companies. I worked with one team that tied their weekly forecast tracking directly to trial signup conversions. An alert for a traffic dip immediately triggered a review of their bottom-of-funnel content. They diagnosed and fixed a ranking drop before it could seriously impact their MQL pipeline and revenue.
Of course, keeping a close eye on your keyword performance is foundational to all of this. You can learn more about how to track SERP position changes in our detailed guide.
By integrating validation, scenario analysis, and active monitoring into your workflow, your forecast becomes more than a number—it becomes your strategic compass.
Frequently Asked Questions
When you first dive into forecasting SEO traffic, a few common questions always seem to pop up. Getting these sorted out early on saves a ton of headaches and helps you build a model that actually works.
Let’s get them out of the way.
What Data Sources Are Essential for Accurate Forecasts?
Relying on a single tool is a recipe for a bad forecast. You'll get an incomplete, often misleading picture. For a truly robust model, you need to pull data from a few key places.
Your go-to stack should include:
- Google Analytics 4 for the ground truth on historical organic sessions and, most importantly, conversion data.
- Google Search Console to track high-level trends in clicks, impressions, and average positions.
- Rank Tracker Exports (from tools like Ahrefs or Semrush) for daily, keyword-specific position data. This is way more granular than GSC’s averages.
- SERP Feature Reports to see how much real estate you own in snippets, People Also Ask boxes, and other rich results that don't always translate to a simple "rank."
Combining these sources gives you both the big-picture trends and the nitty-gritty details needed to understand why things are happening.
Your goal is to create a multi-layered dataset. Historical traffic tells you what happened, while keyword and SERP data help explain the why. That's what makes a forecast smart, not just a guess.
How Do I Choose Between Models?
This is a classic one. The choice between a keyword-based forecast and a statistical model isn't an "either/or" decision. You need both, because they serve completely different purposes.
Think of it like this:
- Keyword-based models are aspirational. They’re perfect for showing the potential ROI of a new content push or for setting ambitious targets. "If we rank #1 for these 10 keywords, we'll get X traffic."
- Statistical models are grounded in reality. They look at your site’s actual historical performance—seasonality, growth rate, and all—to create a realistic baseline of what to expect if you just keep doing what you're doing.
For the most accurate projections, you absolutely need to use both. Start with a statistical forecast to get your baseline growth. Then, layer on keyword-based scenarios to model the specific impact of your planned SEO initiatives.
How Often Should I Update My Forecasts?
A forecast isn't a document you create once and then file away. SEO is too dynamic for that.
Plan to review and refresh your projections monthly. This cadence is the sweet spot—it’s frequent enough to catch any major deviations from the plan but not so often that you’re overreacting to normal, random traffic fluctuations.
You should also schedule a more in-depth quarterly backtest. This is where you rigorously compare your model's predictions against what actually happened. It’s how you fine-tune the model’s accuracy over time. And of course, always update your forecast after a major event, like a site migration, a big algorithm update, or a complete overhaul of your content strategy.
At PimpMySaaS, we help B2B SaaS companies build a powerful brand presence in places your customers are already looking for answers—like Reddit and AI chatbots. We turn conversations into conversions, driving targeted traffic and high-quality leads. Learn how we can get your brand noticed.